A brief preview of an Extremely Effective and Simple
Forex Trading System
The full video course describes the system in detail.
WHAT YOU NEED TO GET STARTED
1. A computer, Internet connection,
2. A system to trade with such as my Pivot trading system.
3. A funded account at a forex market maker broker
You only need a few tools to locate profitable set-ups:
- Price
- Price Bars,
- MACD Divergence
- Pivot Point
- Breakout/test/violations
- Trendline breakout
That and of course your passion to succeed
is all it takes in this wonderful business
of Forex trading.
No other bells and whistles or toys are
required - contrary to what you may have
learned before.
The hardest part for you will be to
"unlearn" all the nonsense you've been
fed about trading prior to coming here.
(Just give your head a good shake;
maybe it will go away).
CHARTS
I use mainly daily, hourly, 15 minute,
and five minute charts. The daily chart
will help you define the overall trend
from a position trading point-of-view,
and the hourly chart will give you a
feel for the intraday trend.
The 15 minute chart is used for entry
and exit - with assistance from the five
minute chart, where price is moving
quickly, and you need to be closer to
the action. Please note that the five
minute is not to be used for scalping,
as there is a lot of noise there,
and you could easily get whipsawed.
Make sure you are using charts that
are generated from the same data source
that feeds the dealing engine, as is
the case with both platforms mentioned
above. That way, what you see is what
you get when you buy or sell. Some
charting packages do not accurately
reflect where price is at any given
moment in time.
PIVOT POINTS
My trading system is based on pivots.
Pivot points are targets, or mile markers,
used for assessing price movement and
determining direction.
If you're unfamiliar with pivot points
and how I use them, below is an overview.
Used by professional floor traders, pivot
trading is one of the oldest and most amazing
technical trading methods available.
Professional traders calculate pivot points
in preparation for each trading sessions.
The pivot lines system is an indispensable
guide for making profitable decisions.
For an active trader, the pivots can mean the
difference between winning and losing.
The Pivot techniques work well in markets with
a wide daily trading range, such as the Forex.
Pivot lines steers traders away from "no man's
land" and identifies "high activity" areas in
which the equity has a high probability of
reversal. These areas are important trading zone
watched daily by floor traders and computer
trading systems.
The levels for the trading ranges and pivots
are the support and resistance levels of the
market in the next time interval.
It is important to note that the predicted
levels only give the range in the next time
interval. They do not indicate when the levels
will be reached by the currency price action.
The pivot is a level at which the underlying
asset can be expected to change direction
and/or move rapidly away from.
My pivots program provides not only Pivot,
R1, R2, S1, and S2, but also the M1, M2, M3,
and M4 points as well. It is common to find
many traders calculating only the Pivot, R1,
R2, S1, and S2 levels. In the Forex market,
however, you will find my additional points
of support and resistance to be very significant
indeed.
The Forexmentor video course shows you how
to calculate the Pivot points using our
proprietary Pivot Calculator.
After you have calculated the pivot numbers
for the day, place horizontal lines on
your 15 minute and 1 hour charts at the
pivot numbers for the day, or at least as
many lines as your chart has room for.
These pivot points will guide your trading
throughout the day.
INDICATORS
I really only espouse one - MACD
(for divergence only).
MACD Divergence is covered extensively
in my course and my trading examples
MACD is my favorite indicator, and that
would be my choice. The nine and 18
exponential moving averages are okay
too to give you some sense of price
direction, but I am not a believer in
using moving averages for this market
- so am not too thrilled about their
application and use.
Go ahead and plot MACD on the charts
you are working with.
For Complete Mentorship
Online Forex Webinar
Showing posts with label MACD. Show all posts
Showing posts with label MACD. Show all posts
Saturday, November 22, 2008
Tuesday, September 23, 2008
Learning Forex Trading -Part 5 - More Technical Tools
TECHNICAL INDICATORS - MACD
There are many other tools used in technical analysis. As you learn forex trading my advice is to focus on a just and master them really well. You will do just find with your trading. However, it is wise to have an idea of what all the other tools are about. In my case, I learnt them just for the sake of knowledge.
In learning currency trading, I have thought myself how to fish dollars whenever I want to. So as you learn forex trading, give it your all, do everything you can to master just moving averages and Parabolic SAR and come up with your own rules and you will do just fine.
What other technical indicators do others use out of there? If you search google you will find many. I am going to touch on a few more indicators, those I feel can help you and then you are done with technical indicators.
1. MACD - Moving Average Convegence Divergence
MACD is an acronym for Moving Average Convergence Divergence. MACD is a sort of oscillator that can measure momentum and as well as follow or indicate a trend.
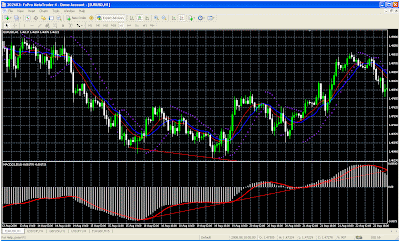
When Gerald Appel developed MACD, he did so to trade a 26 and 12-week cycles in the stock market. However, I have discovered a setup that works best for me. So on your charts the default setup parameter is usually 12,26,9. You really don't need details of what these numbers are. All you have to do is set it up on you chart as you can see from this one below. And you are ready to go. My setup is usually 21,55,8. For some reason these parameters work well for me. Check the chart below:

How do I use MACD in my trading?
Some people trade entirely using MACD to generate both sell and buy signals. I use MACD to confirm my trades. On the chart you see a plot of Simple Moving Average 14 and Weighted Moving Average 14 and Parabolic Sar. Below the chart you will find MACD.
In my chart my MACD is represented by the white histogram. When the white histogram moves above the signal red line I wait for the Parabolic Sar to cross over for a buy trade setup. Once that happens, then I am pretty confident in my trade.
I am still learning forex trading. As you learn forex trading, you will realized that the mastery of a few trading tools is all that's necessary to become a highly successful forex trader. If you can focus on Simple Moving Average 14 and Weighted Linear Moving Average 14 (SMA 14 and WLMA 14) and the Parabolic SAR with the MACD to confirm your trading you will do just fine.
That is my way of trading using only 3 technical indicators. I don't need any thing else to make money.
If you are one of those who want to use just MACD to trade, here is what happens.
There are three main ways to use MACD
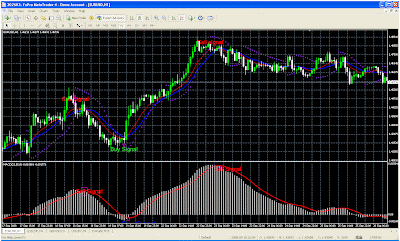
1. Buy and Sell Signal

This chart above is an hourly chart. See how I labeled the buy and sell signals on the chart. Do you see when the buy and sell signals occur from the MACD? Looking at the charts, you can see that your buy signal occur, when MACD crosses over the signal red line and a sell signal occur when MACD crosses below the signal line. So if you are only going to use MACD that is how you trade.
Look at the chart itself. The Buy and Sell Signals labeled on the charts are those following my Parabolic SAR trading system. Do you see that my signals occur about 5 hours before the MACD signals. So in my case, when I trade using my Parabolic SAR signals, at the time the signals are confirmed by MACD, I add to my trade. So you can see that trading the Parabolic SAR system gives you an edge in the market.
Hope you will take some time to learn forex trading using this simple system.
2. MACD can also be used to indicate trend direction.
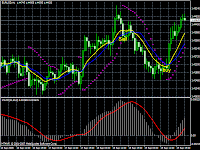
MACD will indicate when a trend is up and when the trend is down. When MACD crosses the zero line and becomes positive then there is uptrend and if MACD crosses below the zero line, then the currency pair is in a downtrend. See Chart.

3. Third use of MACD is too indicate when a trend is about to reverse.
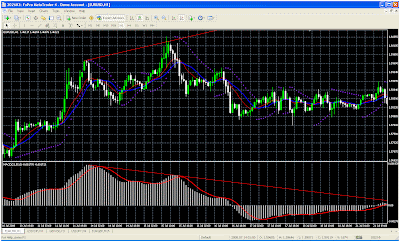
When a divergence occur between MACD and Price (see chart), that means the current trend is weakening. There are two kinds of divergences - the bearish and the bullish divergence
- Bearish Divergence - A bearish divergence will occur when prices are making higher highs, but MACD is making lower highs. This is sign that an up trend is weakening. So you can be sure to watch for a sell signal. Once a sell signal occur after a bearish divergence, then you have got a real winning trade.

-Bullish Divergence - A bullish divergence occurs when prices are making lower lows but MACD is making higher lows. This is an indication that the down trend is weakening. You can watch your chart for a buy signal. Once a buy signal occurs after a bullish divergence, you can be sure of a winning trade.

In my opinion Moving Averages, Parabolic Sar and MACD are the only indicators you need to focus on as you learn forex trading. There are many other indicators. If you still want to explore these as you learn forex trading, then check out the next lesson. I will list a number of these indicators. I don't need them and I believe you don't need them either.
Labels:
Learn Forex Trading,
MACD,
Moving Averages,
Technical Analysis
Monday, September 22, 2008
Learn Forex Trading - Part 4 - Technical Indicators cont.
More Technical Indicators - Parabolic Sar
In my last post Learn Forex Trading Part 3, I mentioned that I only use 2 techinical indicators on my charts. The Moving Averages (Simple and Weighted), The Parabolic Sar And sometimes MACD (Moving Average Convegence Divergence). See diagram below

In my opinion, using the hourly chart, Parabolic SAR (Stop and Reverse) is very good for pin-pointing a new trend pretty early. So it does offer an excellent buy and sell signal. If your mind is strong enough to just do what the chart is telling you with this indicator you will do just fine. Like I said, in part 3. My stop loss is usually placed just about 5 pips above the Parabolic SAR value at the close of the candle.
Parabolic SAR is an outstanding indicator. It works beautifully well in a trending marketing and can keep you long enough in a market to ride out the trend. However, the Parabolic SAR is very unreliable during a sideways trending market, just as the Moving Average. So most of the time, I stay out of a sideways market. If you can stay away from the market, what I suggest you do is drop down your time frame. In my case, since I am mostly trading from an hourly chart, I would drop the time frame to 5 minutes or 1 minute and the parabolic SAR would work just fine in a sideways market.
As you can see from the chart, the points are pretty clear. If you have taken a short position, the SAR pointts will be above the prices, and the signal to go long will be when prices cross the current SAR point from below. (See chart). Once you have entered a position long or short and your stop loss 5pips below or above SAR value, you will notice that the SAR points will be far enough away from price to even permit some counter trend movement without closing you out. Once the currency pair begins to really trend and move in your favor, SAR points will move with prices. When you notice a that price begins to tighten with the SAR points, then get ready to close your position. Sometimes the trend will continue, sometimes it will reverse and hit your stop loss.

What are the main uses of Parabolic SAR
SAR means Stop and Reverse
As you can see from the chart below:
The sell and buy signal were a perfect example of stop and reverse application. In this case. In both cases, you would have earned a nice profit just by obeying the rules. Close your sell position, when the parabolic SAR went below price and enter a buy trade. As I write, that particular buy trade on the chart moved from 1.4262 to 1.4816, before a reverse SAR signal was indicated. That is a whooping 554 pips in less than 4 days. Your only job would have been to check your charts and adjust your stop loss, until the parabolic SAR changed position in relation to price.
Using Parabolic SAR in conjunction with MACD also helps me to ignore false reversal signals in a trending market. Sometimes, a move will stall in such a way as to cause the SAR point to change position. For example if MACD is indicating a strong downtrend move, you would take only short trades and ignore all long signals. But if MACD is showing a strong uptrend, then, you can take only long trades. So in this case you are able to filter all false reversal signals.
Another use for me as mentioned before is to chose my stop loss. After my trade has been taken, I use the Parabolic SAR value to trail my position. Every hour, I adjust my stop loss, 5 pips below or above the parabolic value.
As you learn forex trading using technical indicators, please make sure you keep it simple. Don't crowd your charts with many indicators. As you can see, my chart is clean and clear. I have just 2 moving averages, the Parabolic SAR and MACD.
I hope this lesson on Parabolic SAR will help you achieve your dreams of becoming a master currency trader.
Learn Forex Trading Part 1-Basic Forex
Learn Forex Trading Part 2 - Technical
Analysis
Learn Forex Trading Part 3 - Technical Indicators
In my last post Learn Forex Trading Part 3, I mentioned that I only use 2 techinical indicators on my charts. The Moving Averages (Simple and Weighted), The Parabolic Sar And sometimes MACD (Moving Average Convegence Divergence). See diagram below

In my opinion, using the hourly chart, Parabolic SAR (Stop and Reverse) is very good for pin-pointing a new trend pretty early. So it does offer an excellent buy and sell signal. If your mind is strong enough to just do what the chart is telling you with this indicator you will do just fine. Like I said, in part 3. My stop loss is usually placed just about 5 pips above the Parabolic SAR value at the close of the candle.
Parabolic SAR is an outstanding indicator. It works beautifully well in a trending marketing and can keep you long enough in a market to ride out the trend. However, the Parabolic SAR is very unreliable during a sideways trending market, just as the Moving Average. So most of the time, I stay out of a sideways market. If you can stay away from the market, what I suggest you do is drop down your time frame. In my case, since I am mostly trading from an hourly chart, I would drop the time frame to 5 minutes or 1 minute and the parabolic SAR would work just fine in a sideways market.
As you can see from the chart, the points are pretty clear. If you have taken a short position, the SAR pointts will be above the prices, and the signal to go long will be when prices cross the current SAR point from below. (See chart). Once you have entered a position long or short and your stop loss 5pips below or above SAR value, you will notice that the SAR points will be far enough away from price to even permit some counter trend movement without closing you out. Once the currency pair begins to really trend and move in your favor, SAR points will move with prices. When you notice a that price begins to tighten with the SAR points, then get ready to close your position. Sometimes the trend will continue, sometimes it will reverse and hit your stop loss.

What are the main uses of Parabolic SAR
SAR means Stop and Reverse
As you can see from the chart below:
The sell and buy signal were a perfect example of stop and reverse application. In this case. In both cases, you would have earned a nice profit just by obeying the rules. Close your sell position, when the parabolic SAR went below price and enter a buy trade. As I write, that particular buy trade on the chart moved from 1.4262 to 1.4816, before a reverse SAR signal was indicated. That is a whooping 554 pips in less than 4 days. Your only job would have been to check your charts and adjust your stop loss, until the parabolic SAR changed position in relation to price.
Using Parabolic SAR in conjunction with MACD also helps me to ignore false reversal signals in a trending market. Sometimes, a move will stall in such a way as to cause the SAR point to change position. For example if MACD is indicating a strong downtrend move, you would take only short trades and ignore all long signals. But if MACD is showing a strong uptrend, then, you can take only long trades. So in this case you are able to filter all false reversal signals.
Another use for me as mentioned before is to chose my stop loss. After my trade has been taken, I use the Parabolic SAR value to trail my position. Every hour, I adjust my stop loss, 5 pips below or above the parabolic value.
As you learn forex trading using technical indicators, please make sure you keep it simple. Don't crowd your charts with many indicators. As you can see, my chart is clean and clear. I have just 2 moving averages, the Parabolic SAR and MACD.
I hope this lesson on Parabolic SAR will help you achieve your dreams of becoming a master currency trader.
Learn Forex Trading Part 1-Basic Forex
Learn Forex Trading Part 2 - Technical
Analysis
Learn Forex Trading Part 3 - Technical Indicators
Subscribe to:
Posts (Atom)


