TECHNICAL INDICATORS - MACD
There are many other tools used in technical analysis. As you learn forex trading my advice is to focus on a just and master them really well. You will do just find with your trading. However, it is wise to have an idea of what all the other tools are about. In my case, I learnt them just for the sake of knowledge.
In learning currency trading, I have thought myself how to fish dollars whenever I want to. So as you learn forex trading, give it your all, do everything you can to master just moving averages and Parabolic SAR and come up with your own rules and you will do just fine.
What other technical indicators do others use out of there? If you search google you will find many. I am going to touch on a few more indicators, those I feel can help you and then you are done with technical indicators.
1. MACD - Moving Average Convegence Divergence
MACD is an acronym for Moving Average Convergence Divergence. MACD is a sort of oscillator that can measure momentum and as well as follow or indicate a trend.
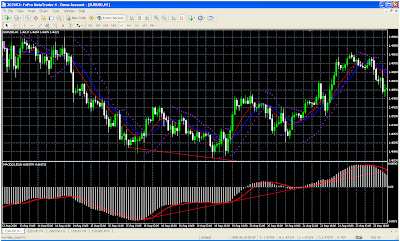
When Gerald Appel developed MACD, he did so to trade a 26 and 12-week cycles in the stock market. However, I have discovered a setup that works best for me. So on your charts the default setup parameter is usually 12,26,9. You really don't need details of what these numbers are. All you have to do is set it up on you chart as you can see from this one below. And you are ready to go. My setup is usually 21,55,8. For some reason these parameters work well for me. Check the chart below:

How do I use MACD in my trading?
Some people trade entirely using MACD to generate both sell and buy signals. I use MACD to confirm my trades. On the chart you see a plot of Simple Moving Average 14 and Weighted Moving Average 14 and Parabolic Sar. Below the chart you will find MACD.
In my chart my MACD is represented by the white histogram. When the white histogram moves above the signal red line I wait for the Parabolic Sar to cross over for a buy trade setup. Once that happens, then I am pretty confident in my trade.
I am still learning forex trading. As you learn forex trading, you will realized that the mastery of a few trading tools is all that's necessary to become a highly successful forex trader. If you can focus on Simple Moving Average 14 and Weighted Linear Moving Average 14 (SMA 14 and WLMA 14) and the Parabolic SAR with the MACD to confirm your trading you will do just fine.
That is my way of trading using only 3 technical indicators. I don't need any thing else to make money.
If you are one of those who want to use just MACD to trade, here is what happens.
There are three main ways to use MACD
1. Buy and Sell Signal

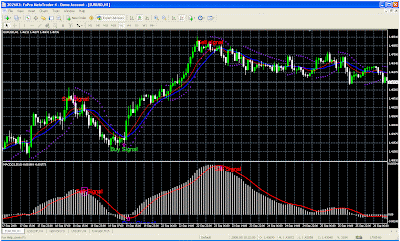
This chart above is an hourly chart. See how I labeled the buy and sell signals on the chart. Do you see when the buy and sell signals occur from the MACD? Looking at the charts, you can see that your buy signal occur, when MACD crosses over the signal red line and a sell signal occur when MACD crosses below the signal line. So if you are only going to use MACD that is how you trade.
Look at the chart itself. The Buy and Sell Signals labeled on the charts are those following my Parabolic SAR trading system. Do you see that my signals occur about 5 hours before the MACD signals. So in my case, when I trade using my Parabolic SAR signals, at the time the signals are confirmed by MACD, I add to my trade. So you can see that trading the Parabolic SAR system gives you an edge in the market.
Hope you will take some time to learn forex trading using this simple system.
2. MACD can also be used to indicate trend direction.
MACD will indicate when a trend is up and when the trend is down. When MACD crosses the zero line and becomes positive then there is uptrend and if MACD crosses below the zero line, then the currency pair is in a downtrend. See Chart.

3. Third use of MACD is too indicate when a trend is about to reverse.
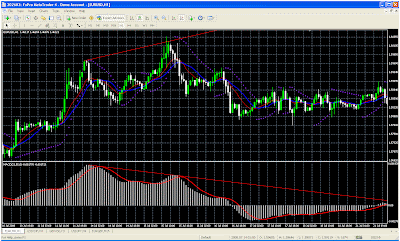
When a divergence occur between MACD and Price (see chart), that means the current trend is weakening. There are two kinds of divergences - the bearish and the bullish divergence
- Bearish Divergence - A bearish divergence will occur when prices are making higher highs, but MACD is making lower highs. This is sign that an up trend is weakening. So you can be sure to watch for a sell signal. Once a sell signal occur after a bearish divergence, then you have got a real winning trade.

-Bullish Divergence - A bullish divergence occurs when prices are making lower lows but MACD is making higher lows. This is an indication that the down trend is weakening. You can watch your chart for a buy signal. Once a buy signal occurs after a bullish divergence, you can be sure of a winning trade.

In my opinion Moving Averages, Parabolic Sar and MACD are the only indicators you need to focus on as you learn forex trading. There are many other indicators. If you still want to explore these as you learn forex trading, then check out the next lesson. I will list a number of these indicators. I don't need them and I believe you don't need them either.


1 comment:
Forex Trading is nothing but earning huge money. As the forex market changes daily, some investors have found it quite easy to make a big money from it. Foreign exchange market is also called as Forex. Forex Market is also referred as FX in online and offline business. Often, you will be able to purchase different types of stocks, bonds and investments through a broker or a financial institution. So, forex trading always takes place through brokers or a financial institution.
Post a Comment